

The regular vowel plot assignment
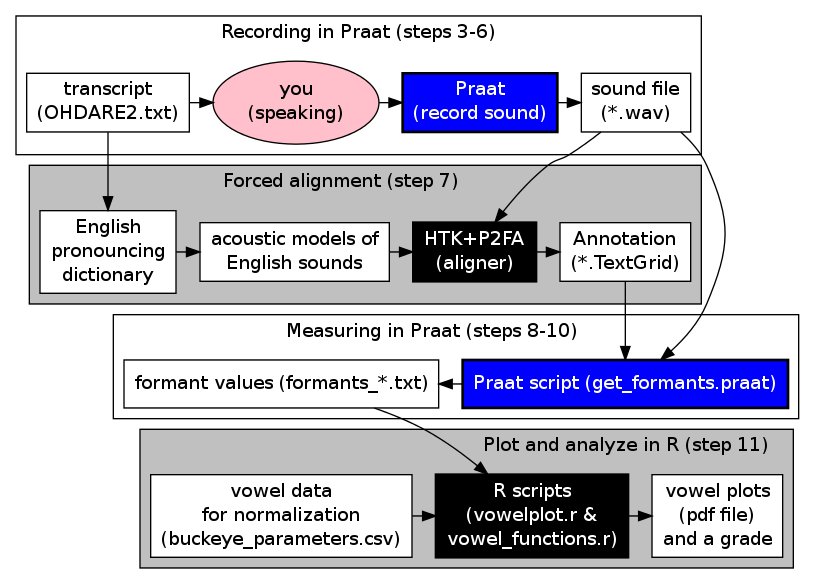
The vowel plot assignment uses step-by-step instructions to walk you through downloading files (steps 1-2) and then using three important speech analysis tools without any prior experience:
- Praat: to make a digital recording of your speech (steps 3-6) and then to measure the formant frequencies at specific time points in your recording (steps 8-10)
- Forced alignment: to generate a time-aligned phonetic transcription of your recorded speech, to guide your measurements (step 7)
- R: to analyze and plot your speech measurements (step 11)
These steps are illustrated in the figure, including steps that are visible to you (like making the recording and measuring it) and “black box” steps like forced alignment and plotting and analysis.
Beyond the vowel plot assignment
With slight modifications, the vowel plot tools can be used for many different things, and making incremental changes to a working script is usually a lot easier than making a new one from scratch.
Changing the recording or the alignment
Small changes
- A different recording: record another person reading the story, or use a completely different recording (of another story, or a conversation, or a word list). Any wav file with an English transcript can be submitted to the forced alignment system on the web or on the Phonology Lab server. Once you have a wav file and a textgrid file, you can follow the remaining steps as usual.
MEDIUM-sized CHANGES
- Align using the command-line interface: Use a recording that can’t be aligned using the web interface because it is too long, or it has words that aren’t in the CMU dictionary, or it is in French. For this, you should follow the instructions for the command-line interface to the Phonology Lab server and (if necessary) making a supplement to the dictionary.
Big CHANGES
- Align in another language: Align a recording that isn’t in French or English. You will need to find aligner resources that someone has already created, or make your own by creating a dictionary, and either making clever use of sounds that are similar to English (read about p2fra in the manual) or using HTK directly (or Prosodylab-Aligner) to train your own acoustic models.
Changing the measurements
As written, the get_formants.praat script loops through every consonant and vowel in the textgrid and measures F1 and F2 at three time points. The small changes are designed to keep the formants_*.txt file in the same format, so it will still work with the on-line vowel plotting script.
SMALL CHANGES
- Measure a different formant: Measure F3 instead of F1, by changing
Get value at time... 1toGet value at time... 3in lines 68, 70, and 72. Leavef1_1etc. alone, unless you also change them in line 76. Then submit your formants file to the vowelplot page as usual. [Note: The pdf will still say “F1” , and your grade will probably suffer, but you will know it’s F3 and that you did it on purpose. You can avoid this by plotting the measurements yourself as described below.] - Measure at different times: Change the numbers in lines 33-35 that determine when the measurements are made. If you change the
3 / 4in line 35 to4 / 5, yourthree_quartersmeasurement will really be 80%. Keep calling itthree_quartersunless you also change it on line 76.
Medium-sized CHANGES
- Measure duration: Measure duration by adding the line
duration = end - startsomewhere after line 32 and before line 76. Then change'f2_3''newline$'to'f2_3','duration''newline$'in line 76 to add a duration measurement to the end of each line. To make use of this, you will want to change the plotting script (below). Alternatively you could change it to'duration''newline$'in order to replace the third F2 measurement and keep the file the same.
Big CHANGES
Note: these are techniques that are likely to be used when measuring vowels. They are natural extensions of the get_formants scheme, and it’s a good exercise to consider implementing them, but you may want to ask around before you spend a lot of time here.
- Measure each segment many times: Instead of measuring each segment at three time points, measure them at small intervals so you can analyze the entire formant contour.
- Change the formant tracking settings for each vowel: Measure vowels differently, depending on their label, or try multiple measurement settings and choose the best measurement.
Changing the plotting or the analysis
When you follow the instructions for the vowel plot assignment, the plotting is done on the server, out of your view (just like the forced alignment). The plotting is done using R scripts that you can run yourself if you have R installed. If you don’t have R, go to the Comprehensive R Archive Network (CRAN) and download and install it. Download these three files and put them in the folder where your formants_*.txt file is located: vowelplot.r, vowel_functions.r, buckeye_parameters.csv. Of these, vowelplot.r is the file you will interact with the most. The others do work in the background. After you run R, you may need to type setwd(mydirectory), where “mydirectory” is the folder where those files are. It will need to be in quotes. To find out how R expects you to format directory paths, enter getwd() to see what your current working directory is. Open vowelplot.r, change line 13 so that instead of 'formants_temp.txt' it says the name of your formants file (keeping the single quotes around the filename), and save the file. The first time you run the commands in vowelplot.r, you might get an error message saying you need the package “car”. If you have a graphical interface for R, find the menu command that lets you install packages and install car and its dependencies.
SMALL CHANGES
- Make the plots bigger: Open vowelplot.r in a text editor. Line 87 determines how big the pdf of plots will be. The default is 6 inches by 6 inches. To make a big plot (so you can read the words more easily), change
height=6, width=6toheight=12, width=12and save the file. Then in R, typesource('vowelplot.r'), to run the script just like the server would, but making bigger plots. Look for a pdf to appear in your working directory. - Make plots interactively: At the end of vowelplot.r are some sample commands, with instructions. Try pasting the plot commands into R, and look at the plots.
- Use the right names for things: if you changed get_formants.praat to measure F3 and plotted using the server, your axes were mislabeled. You can fix that now by changing the lines that names the axes: if you changed F1 to F3 in the Praat script, change each occurrence of
F1_frequencyin lines 56-58 toF3_frequency, and look for any other occurrence ofF1in the script and change it toF3.
Medium-sized CHANGES
- Plot by duration: First follow the instructions above for “measure duration”, making a new column for duration. Then change line 56-58 of vowelplot.r as follows:
changemeasurement=0.25),tomeasurement=0.25, duration=my_data[,10]),
changemeasurement=0.50),tomeasurement=0.50, duration=my_data[,10]),
changemeasurement=0.75))tomeasurement=0.75, duration=my_data[,10]))That will add duration measurements to the data table you’re using to plot your vowels. Add this line somewhere between line 58 and line 78:
formants_me$long <- formants_me$duration > median(formants_me$duration)
This column will containTRUEorFALSEfor each segment, depending on whether it is longer than the median segment duration. Look at the group of lines starting at 105, including this one that plots the pre-lateral vowels (i.e., the vowels whose segment to therightis'L'):
main <- 'Pre-lateral vowels at 25%'; context.vowelplot('right', c('L'))
Add a new line that does something similar, except uselonginstead ofright, and useTRUEinstead of'L'.mainis the title for the plot. Change it to something that accurately describes what you are plotting. Paste the command in R to see the plot. If you like it, put the command in between thepdf()command (line 87) and thedev.off()command (line 114), so that it gets included in your vowel plot pdf file.
Big CHANGES
- Measure completely different kinds of data: Get articulatory data in a file you can open in R, and then use the same plotting functions to plot it.